A Little Fun with History
Wow! It’s been a while since my last blog – about two months. My apologies. I know it is hard to say this in my “retired” state, but I have been really busy with personal/family commitments and business/consulting matters. Anyway, here I am on March 15th, the Ides of March, and I am reminded of the famous Shakespearian play Julius Caesar. As described by Shakespeare, a soothsayer (fortuneteller) roams the streets outside Caesar’s palace in the days leading up to Mar 15th, calling out to Caesar in his palace, “Beware, Caesar, the Ides of March!” This is a foreshadowing of Caesar’s assassination by Roman Senators on that day in 44 BC. [PS: Caesar’s close friend, Marc Anthony, offers a soliloquy for Caesar while gazing over the dead body, and the spectacular writing and vocabulary of Shakespeare is on full display! It’s worth a read … “O pardon me, thou bleeding piece of earth, That I am meek and gentle with these butchers. …”]
Besides my penchant for history, literature and other such cultural curiosities, I chose this title because I want you to “Beware!” on this Ides of March. My wariness is based on an article published in PLoS Medicine on 25 Feb 2020 and reported online by the New York Times on 5 Mar 2020. Why PLoS Medicine publishes this stuff and the NYT reports on it is a source of befuddlement for me. Let me explain more.
Back to the Present Day
Let’s start with the publication: “Association of moderate alcohol intake with in vivo amyloid-beta deposition in human brain: A cross-sectional study.” [1] The main conclusion of the study is as follows: “A moderate lifetime alcohol intake (1–13 SDs/week) was significantly associated with a lower Aβ positivity rate compared to the no drinking group, even after controlling for potential confounders (odds ratio 0.341, 95% confidence interval 0.163–0.714, p = 0.004).”
The NYT published this online headline: “Moderate Drinking Tied to Lower Levels of Alzheimer’s Brain Protein,” with their take-away message of, “Compared with abstainers, those who drank up to 13 standard drinks a week had a 66 percent lower rate of beta amyloid deposits in their brains.”
I will leave the NYT alone for now and concentrate on the scientific publication as I ask my usual question, “Are you sure?”
Where to begin?! I guess at the beginning.
As stated in the publication: “This study was part of the Korean Brain Aging Study for Early Diagnosis and Prediction of Alzheimer’s Disease (KBASE), an ongoing prospective cohort study that started in 2014. The KBASE study aimed to search for new AD biomarkers and investigate how multifaceted lifetime experiences and bodily changes contribute to the brain changes related to AD.” [Translation: This is a very large fishing expedition. Now, I recognize that not every hypothesis – in fact very few hypotheses – can be tested using randomized controlled trials. We must learn from observational research. I also recognize that such research needs to be conducted assiduously, data analyzed carefully, and results interpreted cautiously.]
This study presented in the publication reviewed here included 414 elderly patients (50-90 years old) from Seoul, South Korea who did not have dementia nor alcohol-related disorders. Alcohol consumption categories were pre-specified (that’s good) and their rationale justified by references. Obviously, I am not a neurologist or a clinician, so I will assume all the clinical assessments and brain imaging measurements were done appropriately and well. I also assume data collection was rigorous and every effort was made to be unbiased doing patient assessments, though there is no mention (and perhaps no possibility) of blinding evaluators.
The study collected alcohol consumption via structured surveys along with other demographics and relevant baseline characteristics. Patients were subjected to PET scans to quantify various aspects of their brain morphology, most notably the presence of the Aβ protein. Other measures of AD included Aβ retention, cerebral glucose retention, cortical thickness and white matter hyperintensities (WMH). The goal was to explore associations between alcohol consumption, while adjusting for covariates, and these markers of AD, most notably the presence of Aβ.
A Reasonable Layman’s Critique
With that background, I am on to my non-statistical critique. Later in this Blog I will give some statistical critiques, which I will try to keep readable and understandable to non-statisticians, but also may be of greater interest to statisticians or those with related quantitative skills.
First, any time I see the word “Association” in the title of a paper, I cringe. I just do not know what to do with “associations.” [See Blogs 2 and 3] While almost all authors of such studies say something like, “causal relationships cannot be inferred from the findings” (as they do in this paper), they routinely use language that sound very much like cause and effect (as they do in this paper), “the present findings … suggest that moderate lifetime alcohol intake may have some beneficial influence on AD …” And elsewhere they state or imply a cause and effect relationship, “the protective effects of moderate alcohol intake against Aβ pathology involve the chronic effects associated with long-term exposure.” Lastly on this point, if there is a cause and effect relationship, I never know which direction the causal arrow points. Does better cognitive/brain health allow one to socialize more, resulting in more drinking? Or does more drinking have some beneficial effect on Aβ (as the authors suggest)?
Second, when I read the main results, I think about practical plausibility (one could say biological or medical plausibility as well). So, am I to believe that not drinking or <1 drink pre week – has no effect on these brain measures; then 1-13 drinks per week has a big effect (66% reduction in Aβ presence); then 14+ drinks does not have an effect! To repeat another way: no drinking or minimal drinking (<1 drink per week) does nothing to help my brain, my risk of AD or my cognition, but 1 drink per week confers a 66% reduction in Aβ deposition, which the authors link to lower risk of AD! Wow! That’s a potent drink, and all efforts should be made to get regulatory approval for this wonder drug called alcohol! At the other end, am I to believe that 13 drinks per week confers a 66% reduction in Aβ deposition, but with 14 drinks per week, I lose that remarkable benefit! By the way, I found some definitions of alcohol use disorder that included 14 drinks or more per week in men and 7 drinks or more per week for women. That’s a sobering thought (ooops – pardon the pun).
Third, dietary/nutrition/consumption publications seem to produce results that are most questionable or irreproducible [3]. Perhaps it is due to recall bias, which these authors note as a possible shortcoming, or the fact that there are so many confounding factors regarding our lifestyle, especially in longer-term (retrospective) studies. So, right or wrong, I read the results of any food or drink study with suspicion. Perhaps you should too.
Some Quantitative Assessment for Non-Statisticians
Now I will delve into some more quantitative aspects of the study and my critique of some of the work and conclusions from this report. For the rest of this Blog, I refer to exposure groups to describe how the authors categorized alcohol consumption:
Control: no drinking
Low: <1 drink per week
Medium: 1-13 drinks per week
High: 14+ drinks per week.
Drinks were standardized to represent a specific volume of alcohol or in order to pool data from beer, wine and liquor. The authors looked at alcohol consumption during a subject’s life-time consumption pattern and consumption in the last year (i.e. described as “current” consumption).
The first thing that struck me comes from Table 1 of the paper which summarizes key variables used in the analysis. Of the many items presented in that Table, two observations stand out.
Consumption Group Sample Size Percentage Male
Control 227 16.7
Low 16 50.0
Medium 125 72.8
High 46 93.5
First the samples sizes for the Low and High groups are terribly small for making any meaningful inference, especially the Low group. Second, consumption is very strongly confounded with being male – the greater the consumption, the higher percentage of males. Thus, any downward trend in Aβ positivity with alcohol consumption could really be related to Aβ positivity being less likely in males (I do not know the biological plausibility of this latter statement). Later, I will discuss their models for comparing consumption groups for Aβ positivity, in which they include or adjust for gender in their models, but such statistical adjustments that merely add a gender term to a logistic regression model are unlikely to be sufficient to adjust for this extreme confounding.
More Detailed Statistical Assessment
Multiplicity
I always look for lurking multiplicity issues – that is the penchant for researchers to define multiple outcomes, run multiple models for analysis, compare multiple groups versus the control or each other at multiple timepoints, etc. There is the rather cavalier statement in the paper that seems to accompany many observational research study publications … “Additionally, we explored the associations between other categories of alcohol intake and the neuroimaging biomarkers mentioned above.” Let’s investigate this.
Outcomes: The outcomes investigated were Aβ positivity (presence or absence defined by a PET imaging threshold), Aβ retention, AD-cortical thickness, AD-signature cerebral glucose metabolism and WMH. That’s a total of FIVE.
Models: They used THREE models to assess associations: Model 1 used the clinical measure and alcohol consumption; Model 2 used Model 1 plus selected covariates; Model 3 built on Model 2 and included all covariates.
Group Comparisons: Each of the THREE alcohol consumption groups (Low, Medium, High) were compared versus the Control group.
Time Points: All analyses were done for TWO timeframes – life-time alcohol consumption and current alcohol consumption.
That’s 90 possible combinations for analysis and reporting of p-values and confidence intervals (See Tables 2 and 3 of the paper). Now, the paper is written as if the analysis of Aβ positivity using Model 3 for life-time consumption and comparing the Medium consumption group to Control was the primary focus of the research. And it may have been something like that, but it is also the analysis that produces one of the two smallest p-values of the 90 presented. Coincidence? Hmmm. To be fair, Models 1, 2 and 3 produce similar conclusions for a significant reduction in Aβ positivity in the Medium consumption group (p-values in the range 0.002-0.004). It seems that some penalty for multiplicity needs to be paid unless the authors can document this decision of outcome, Model and timeframe a priori. I wonder if another outcome or the current timeframe analysis turned out to be the most significant whether the authors would have written a very similar publication as this one, but with those other aspects being the centerpiece of the publication. I suspect so.
I believe it is much more reasonable to look at trend test across the consumption groups. In reviewing the data there seems to be evidence on several outcomes and multiple Models for a trend rather than a discrete benefit in the Medium group only. Of course with such very small samples sizes in the Low and High groups, it is unlikely that anything would be statistically significant when comparing them individually to the Control. The estimates of effect could be construed as a trend in response that might be smoothed with more data at the Low and High end of the exposure curve (see Figure 1 in the paper).
And finally, what observational study analysis would be complete without pointing out some significant subgroup findings? In some further exploratory analysis, the authors examined only the Medium group (after all, that is where all the effect is) and age since they had found a significant interaction there. The net-net (see Table S7 in the Supplemental Material) is that the reduced Aβ positivity in the Medium group was only seen in subjects older than 75 (OR=0.080, p<0.001)! That’s a strikingly low OR estimate! I suspect that age 75 was derived from the data rather than pre-specified, and I also note that 75-year old’s in the High consumption group had small OR with a p-value of 0.072 (again with a much smaller sample size).
(Mis)Use of P-values
The paper also reports, “While moderate lifetime alcohol intake had a significant association with Aβ deposition, moderate current intake did not.” I need to point out (Table 2 of the paper) that the analysis of current timeframe using Models 1, 2 and 3 resulted in p-values of 0.02, 0.05 and 0.068 respectively. The quoted statement above is in reference to p=0.068. This is why the ASA issued its statement on p-values and emphasized (as statisticians have done for decades) that a bright line effect/no-effect at p=0.05 should not be reported as such. The authors go on to give some post hoc explanations of why chronic consumption matters more the current consumption, which may be true, but if I were going to take a frequentist approach, I would note the supportive evidence of the current timeframe rather than discount it as showing no effect simply because one p-value is ever-so-slightly above 0.05.
Using Model 3 as the primary analysis, as the authors did, results for the High consumption group produces an odds ratio similar to the Medium consumption group (OR=0.34 for Medium; OR=0.42 for High) with the High group having a p-value of 0.092. Note that for Model 2, the OR for the High group is 0.41 (p=0.069). Again, keep in mind that the sample size for the High group is only 46 people AND a p-value greater than 0.05 does not mean there is no effect, especially when there are similar OR estimates with the Medium group.
Finally, there is a consistent trend in AD-cortical thickness response across models that is exhibited only in the High group for the current timeframe (I should be penalizing myself for multiplicity !!). For Models 1, 2 and 3, the comparison of the High group to the Control produces p-values of 0.01, 0.09 and 0.07, respectively. Pretty small p-values for only 46 subjects in the High group. Again, perhaps the effect, if you are willing to believe it is there, is not relegated to the Medium group only.
Bayesian Thinking
There was an extensive review of the literature (I assume this because there were many, many citations in the refence list) to justify why these Korean researchers were pursuing this line of study. They note preclinical models, both in vitro and in vivo, provide some suggestive evidence of alcohol interference with Aβ deposition or formation. They do note, “While many preclinical studies and some human magnetic resonance imaging (MRI) studies suggested that moderate alcohol intake has a protective effect against neurodegenerative or cerebrovascular injury, others did not observe a protective effect of alcohol.” (references provided in the article). I am discussing this because, as you may well expect from me, I want to have some sort of prior for the hypothesis these researchers are studying so I can interpret the p-value appropriately. See Blog 5: “The Bet” for why one needs a prior to put a p-value in proper context.
I did not want to review dozens of articles to see what I thought about the evidence for this hypothesis, so I chose one that was a systematic review and meta-analysis of dozens of other observational research studies on this topic. That systemic review was done by researchers at Imperial College London, University of Sheffield and St. Charles Hospital London [2], albeit perhaps a bit dated (2008). They sorted through 23 observational research studies (20 epidemiological cohort, 3 retrospective matched case-control) and found significant heterogeneity across studies (p<0.05 – though I hesitate to use p-values to describe this) and across outcomes measured (dementia, AD, vascular dementia, cognitive decline). If I cut to the chase, their conclusion was: “In summary, there was no close agreement among studies as to the optimal level of [alcohol] consumption, and although most studies reported that light to moderate consumption was best with regard to incident decline or dementia, the classification of light to moderate drinking varied very widely [across studies].”
As the authors of this paper note, there have not been studies of alcohol consumption and Aβ deposition or related measures. So, I am thinking there is some evidence on this topic for an alcohol effect on dementia, there is nothing on Aβ deposition, and the definition of “light to moderate” alcohol consumption is vague. I cannot claim to be an expert in this field or to be current with the literature etc., but I will be generous and assign a prior of 30% that this definition of Medium alcohol consumption has a measurable effect on Aβ deposition.
Since I believe that the authors would have published there paper had there been no effect on Aβ deposition but rather on AD-cortical thickness or one of the FIVE measures in the study, I am going to divide that 30% by five to get a prior of 6% for each measure. I will let the multiplicity for the THREE Models aside as well as the multiplicity for the THREE alcohol consumption groups since they stated their primary interest in the Medium consumption group – I will give them the benefit of any doubt that this was done a priori since that seems to be what is in the literature they have cited. However, I also suspect that any statistically significant finding in the “current” timeframe would have also led to a publication, so I feel compelled to adjust for that. So, 6% become 3% due to the TWO timeframes.
Now we are set to apply my favorite simple tool using Bayes Factor to compute an upper bound on the posterior probability of the null hypothesis of no effect of Medium alcohol consumption on any of the brain imaging measures in any timeframe. See Blog 6 “Détente” for details, but here it is straightaway.
Let p equal the p-value from the hypothesis test of interest. The Bayes Factor Bound is
BFB=1/[-e*p*ln(p)].
Let po be the prior probability for that hypothesis. Then the upper bound on the posterior probability that H0 is false (p1) given the observed data is
p1 ≤ p0*BFB/(1-p0+p0*BFB).
Thus, our p0 is 0.03 (3%) and I will use their p-value or 0.004 on which their primary conclusion is based (the second smallest p-value of the 90 published … who knows how many are out there?) which results in an upper bound for the posterior probability that the null hypothesis is false of 0.34. That’s not a small probability (keep in mind it is an UPPER bound) but it is a far cry from a highly significant finding to be broadcast to the world by the NYT! If you want to be less generous than me on the initial prior of 30% and start with 10% (perhaps more realistic), then the analogous upper bound on the posterior probability is 0.14. If you want to be more liberal and start with 50%, then the analogous upper bound on the posterior probability is 0.47.
Summary
On a technical level, there are statistical shortcomings of this research as presented in this paper.
It is only at the very end of the paper that there is a note about lack of power to detect the effect of consumption on these physiologic brain measures due to lack of sample size. From my viewpoint, having only 16 subjects in the Low group is completely meaningless and having only 46 subjects in the High group is not very helpful – maybe not even worth reporting on … unless they were incorporated into a trend test which uses all consumptions group in the analysis rather than pairwise comparisons. The emphasis on pairwise comparisons, especially without multiple comparison adjustments, is also quite troubling.
Then there is the misuse of p-values throughout the paper for making yes/no decisions on the effect of alcohol consumption.
At no point in the Discussion or anywhere in the paper is the severe confounding of gender with consumption group mentioned. As noted earlier, statistical adjustments that merely add a gender term to a logistic regression model are unlikely to be sufficient to adjust for this extreme confounding.
It is not clear to me why there wasn’t a natural inclination to examine trends across a semi-quantitative predictor variable like alcohol consumption. In fact, why not use each subject’s estimated alcohol consumption measure or break the alcohol consumption intervals into smaller clusters (1-5 drinks per week; 6-10 drinks per week etc) and perform some form of linear (or nonlinear) regression analysis to test for a trend?
On a non-technical level, it is difficult to translate this research into anything meaningful. What am I to believe?
In the “final analysis,” what did the paper say? Tthe effect in the Medium consumption group, which is what the authors declared as their significant finding, was based on a post hoc subgroup of 156 subjects over the age of 75. Thus, if I am a non-drinker, minimalist drinker (<1 drink per week) or a heavy drinker, but not an alcoholic (14+ drinks per week) OR I am under the age of 75, then there is no effect of drinking on Aβ deposition. But if I am a Medium drinker (1-13 drinks per week) AND over the age of 75, then there is a 92% reduction in the odds of Aβ deposition in my brain (OR=0.08 in Table S7). I am describing this rather unbelievable interpretation based on how the authors have done their analysis and used p-values to point to significant and insignificant findings.
I think there is some evidence (based on posterior probabilities from this study) that alcohol consumption is associated with these brain biomarkers. I think the description of the effect is more subtle than conveyed by p<0.05 and p>0.05. It appears to me that there are some trends across alcohol consumption levels that are difficult to assess since the sample size was so small in the Low and High consumption groups. Even if all of this is true, do we want to encourage people to drink up to 13 drinks per week for their lifetimes to reduce the potential for AD?! Aren’t there other deleterious effects of alcohol that should be avoided at that level of consumption?!
With all that said about “associations,” I am more skeptical about cause and effect. Which direction does the causal arrow point if one exists? Here I put forward a (plausible?) explanation suggesting that the association is merely spurious (like ice cream consumption and polio – See Blog 2 “Association, Correlation and Causation”).
People who drink more tend to be more socially engaged and gregarious (either naturally or motivated by their moderate drinking). We have found that social engagement is important to long-term cognitive health and even survival. So maybe alcohol consumption is merely a “biomarker” for social engagement, and it is the social engagement that is driving the better mental outcomes. Furthermore, too much alcohol consumption can lead to alcohol abuse disorder resulting in fewer and less healthy social interactions (hence a reduced effect).
See Figure 1.

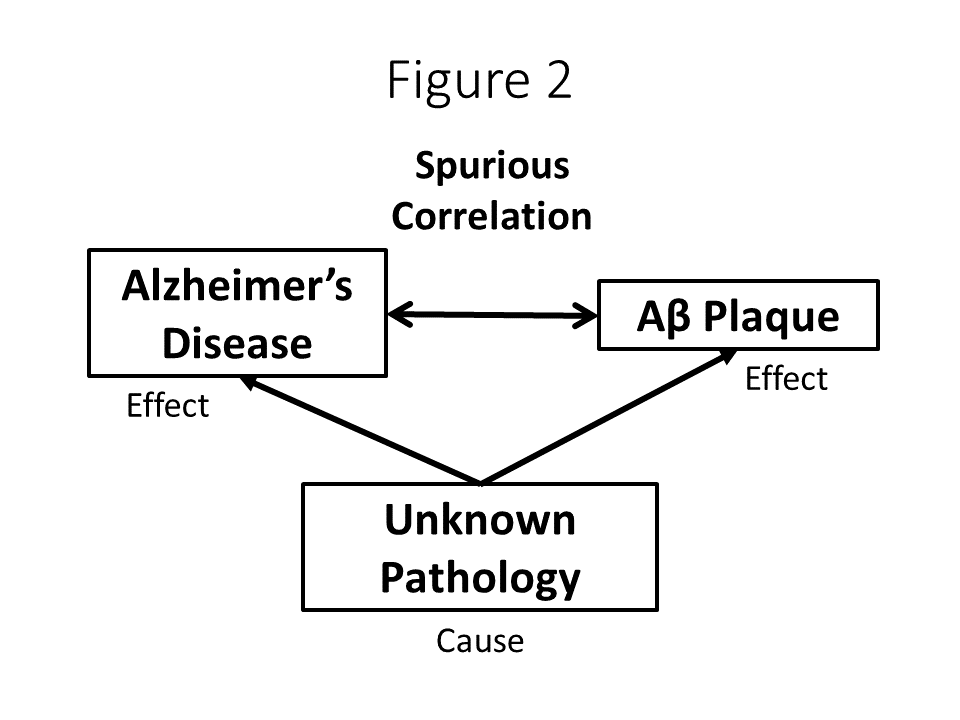
As for cause and effect with Aβ deposition and Alzheimer’s Disease, let’s put this into a broader perspective. Of note, no clinical attempts (i.e. via the use of medication) to lower Aβ have resulted in improvement in AD, even when the actual burden of plaques has been measured. The road is littered with failed pharmaceutical trials. It has always been the case that researchers have said that there is a strong association between Aβ plaques in the brain and AD. Based on that association, there has been a tacit jump to a causal relationship, i.e. Aβ plaques cause AD. That is the basis for decades of research on how to eliminate, reduce, prevent the accumulation of Aβ in the brain. With all the failures of clinical research in this domain, some are now questioning whether Aβ and AD are really just another example of a spurious correlation. Again, the picture looks like Figure 2. Therefore, whether or not alcohol consumption has any effect on reducing Aβ deposition, that effect may be entirely irrelevant for either prevention or mitigation of Alzheimer’s Disease.
Finally, why did the NYT report on this? A slow day at the office? Based on the journal website for the article, on Mar 14, 2020 metrics for any response to this article were: Reader Comments = 0; Media Coverage = 1. I am very much sympathetic to a reader’s comment to the original NYT online posting of this article: “In other news, a study found that umbrellas are found to cause rain.”
Thanks to Dr. Frank Rockhold for the reminder to share this link to an article in the NYT about how to read a medical publication/article. The NYT should take the advice of its own reporting! https://parenting.nytimes.com/health/medical-study-concerns
References
[1] Kim JW, Byun MS, Yi D, Lee JH, Ko K, Jeon SY, et al. (2020) Association of moderate alcohol intake with in vivo amyloid-beta deposition in human brain: A cross-sectional study. PLoS Med 17(2): e1003022.
[2] Ruth Peters, Jean Peters, James Warner, Nigel Beckett, Christopher Bulpitt (2008). Alcohol, dementia and cognitive decline in the elderly: a systematic review. Age and Ageing, Volume 37, Issue 5, September 2008, Pages 505–512.
[3] Ioannidis, J. P. A. (2013) Implausible results in human nutrition research. BMJ 347:f6698.

Great stuff Steve. Reminds me of the NYTimes piece: https://parenting.nytimes.com/health/medical-study-concerns
Which should be an appendix to every press report. Excellent summary and great teaching case. Admire your dedication.
LikeLike