Preface
First, there is a disclaimer since I am a former employee of Eli Lilly and Company and the example comes from a Lilly drug development program – solanezumab for Alzheimer’s Disease (AD). The following is a Steve Ruberg analysis (post hoc). It does not use information from Lilly. I am using publicly available information in my analysis of this example. It is meant solely to be illustrative and does not represent what analyses were done by Lilly, which were much more sophisticated than presented here, or how decisions were made by Lilly.
The Short Story
Solanezumab is a monoclonal antibody developed by Lilly for AD. It was designed to limit or reduce the accumulation of the signature amyloid-beta (Ab or A-beta) plaques that occur in the brains of AD patients. It was one of the first molecules to show signs of promise, but as such, there was not a lot of clinical experience with such agents. There were 3 Phase 3 trials called Expedition trials. Two were done in parallel, Expedition1 and 2, which gave different and marginal results; subsequently, Expedition 3 was completed and meant to be the tiebreaker to confirm whether solanezumab was effective, specifically in the subgroup of Mild (AD) patients. What I present is one perspective for how to interpret some confusing, contradictory and borderline results with particular emphasis on a Bayesian approach.
Of course, being a traditional drug development program, the approach was based largely on the frequentist paradigm – from power calculations in the design of the studies to inference in the final analysis. Expedition 1 and Expedition 2 enrolled mild-to-moderate AD patients and were done contemporaneously with identical designs but used different clinical investigative sites. The primary analysis variables were ADAS-cog11 and Activities of Daily Living (ADL) rating scales. There was also an interest in analyzing the Mild and Moderate subgroups separately as well as those who were APOE(+) and APOE(-), although these subgroups were NOT incorporated into a formal multiple comparisons plan. Expedition 1 completed a couple of months ahead of Expedition 2, which afforded an opportunity to review the results of Expedition 1 while Expedition 2 was still blinded. For the sake of brevity in this Blog, I will focus only on the cognition endpoint ADAS-cog.
The results of Expedition 1 and Expedition 2 were published jointly in the NEJM [1].
The pre-planned primary analysis of Expedition 1 showed that there was no statistically significant result for All Patients (Mild and Moderate) on ADAS-cog11 (p=0.24). However, the analysis of the Mild subgroup showed a strong response with p=0.008 for the difference between solanezumab and placebo on ADAS-cog11. Other subgroups did not show any significant treatment differences. Furthermore, ADAScog-14 was thought to be a more relevant rating scale for Mild patients, and the treatment effect for ADAS-cog14 for the Mild patient subgroup was 0.003.
Of course, the big question is, “Is this a real or spurious finding?”
After consultation with regulatory agencies and others involved in the trials, the primary analysis of Expedition 2 was changed, prior to unblinding, to the Mild subgroup and ADAS-cog14. That primary analysis resulted in p=0.06 (so close!!!!). Ironically, the p-value for All Patients on ADAS-cog11, the original primary endpoint for Expedition 1, was 0.04. Furthermore, for ADAS-cog14 in All Patients, the p-value was also 0.06 (the same as in the Mild subgroup). See Table 1 for a summary of reported results.
Table 1. Summary of hypothesis testing results/p-values for Expedition studies
| Population | ADAS-cog11 Expedition 1 | ADAS-cog11 Expedition 2 | ADAS-cog14 Expedition 1 | ADAS-cog14 Expedition 2 |
| All Patient | 0.24* | 0.04 | 0.09 | 0.06 |
| Mild | 0.008 | 0.05 | 0.003 | 0.06* |
| Moderate | 0.43 | 0.26 |
* Primary analysis p-value.
The NEJM article used the traditional frequentist hypothesis testing decision-making paradigm with p<0.05 being a significant result and p>0.05 being a non-significant result. Thus, both studies were a failure since the primary analysis p-value for Expedition 1 was 0.24 and for Expedition 2 was 0.06.
A Bayesian Perspective
OK, so the question stands … “What is the probability that the finding in the Mild patients is real or chance?” The results are a bit mixed, and the frequentist perspective and traditional decision-making must deal with p-values that are hovering just above and just below 0.05. I am going to talk about quantifying the probability that the null hypothesis is false (i.e. solanezumab works) using a Bayesian approach because I believe that hypothesis testing does not provide a unified system of inference to make an overall decision.
Using a Bayesian approach, we must start with a prior probability that solanezumab works. I am going to set that probability at 30%. Thirty percent might be generous by some people’s account because every drug for AD has failed to date (more on aducanumab in a bit), but I am going to be generous because there is a biological mechanism linking solanezumab to the purported cause of AD. Evidence from mouse models (for what that is worth) and Phase 2 data suggesting Ab efflux from the CNS support the mechanism of solanezumab. So, that is a starting point.
There were five hypotheses of interest – one for the primary objective for the overall population, and one for each of the 4 other subgroups define by mild and moderate AD symptoms and APOEε4 status – carriers or non-carriers. Those latter two variables, disease severity (mild, moderate), and APOEε4 status created subgroups of interest, and were even pre-specified, but were not incorporated formally into a multiple comparisons procedure in the primary analysis.
The next step is to break down that prior probability. If there is a 30% probability that the drug works, then one question might be, “How do I divvy up that probability amongst the overall population and the subgroups of interest?” I’m going to give most of the probability to the overall population, 14%, since it was of primary interest. I will apportion the remaining 16% probability equally across the four subgroups (Version A in Table 2). For the sake of argument, I could also divvy the probability giving heavier weight to Mild patients and APOE status of carriers because some thought the drug might work better in those subgroups (Version B in Table 2). Thus, for the sake of illustration, the total prior was allocated across the overall population and these subgroups according two different strategies, A and B. The focus is going to be on the Mild subgroup because that is the subgroup that looked most interesting when the initial Phase 3 studies were done.
Table 2. Two strategies for allocating the prior that solanezumab works for the primary analysis and pre-specified subgroups
| Hypothesis | Prior Strategy A | Prior Strategy B |
| Overall | 0.14 | 0.14 |
| Mild | 0.04 | 0.06 |
| Moderate | 0.04 | 0.02 |
| APOE ε4(+) | 0.04 | 0.06 |
| APOE ε4(-) | 0.04 | 0.02 |
| Total | 0.30 | 0.30 |
There is one last consideration for dividing the prior. Since there was a post hoc assessment that led to the consideration of a new primary endpoint (switching ADAS-cog11 to ADAS-cog14), a prior probability for the Mild subgroup and the ADAS-cog14 efficacy measure is needed. A simple approach is to divide the prior for the mild subgroup in half – 0.02 and 0.03 for Strategy A and B, respectively.
As with previous Blogs (see Blog 5, 8 and 9), I will use the Bayes Factor formula [2] for combining a prior for a hypothesis (p0) and a p-value for that same hypothesis (p) to calculate an upper bound on the posterior probability of the null hypothesis is false (p1). That is given here.
p1 <- {1 + [(1-p0)/p0] x [-e x p x ln(p)] }-1 Eq 1.
Focusing on the Mild subgroup, since the crucial question is whether the nominally significant finding in Expedition 1 is spurious or real, using Eq 1, the following posterior probabilities are given in Table 3.
Table 3. Upper Bounds for the Posterior Probability at Solanezumab Works for the Mild Subgroup for Two Prior Allocation Strategies
| ADAS-cog11 | ||||||
| Initial Prior | P-value | Posterior Upper Bound | Revised Prior* | P-value | Posterior Upper Bound | |
| Strategy A | 0.04 | 0.008 | 0.28 | 0.02 | 0.008 | 0.16 |
| Strategy B | 0.06 | 0.008 | 0.38 | 0.03 | 0.008 | 0.23 |
| ADAS-cog14 | ||||||
| 0.02 | 0.003 | 0.30 | ||||
| 0.03 | 0.003 | 0.39 |
* Initial prior subdivided for the introduction of a new endpoint, ADAS-cog14.
If one sticks to the pre-specified primary outcome of ADAS-cog11, which had a p-value of 0.008 for the Mild subgroup, then the upper bound on the posterior probability that the null hypothesis is false (i.e. Solanezumab works) is in the range 0.28 to 0.38, depending on your prior belief. The post hoc observation that the Expedition 1 results were better using ADAS-cog14 (p=0.003) is penalized using a smaller prior. The resulting upper bound on the posterior probability is in the range 0.30 to 0.39, depending on your preferred prior strategy.
This is a very interesting result! The initial evidence (probability) that solanezumab works based on ADAS-cog11 is in the approximate range 30-40%. After changing course based on observed data, the apparently stronger results based on ADAS-cog14 actually provide the SAME degree of evidence (probability) that solanezumab works – about 30-40%.
In the frequentist paradigm, it is difficult to judge how to weigh a p-value of 0.008 and 0.003, especially in the context of a post hoc, data-driven change from ADAS-cog11 to ADAS-cog14. As described above, the Bayesian paradigm can provide a coherent framework, and because the result is a probability calculation about the null hypothesis being false, it is easily interpreted. Furthermore, it is easy to incorporate the results of Expedition 2 into the Bayesian framework.
The posterior probability of the null hypothesis being false from Expedition 1 can be used as the prior probability for Expedition 2. Using the larger initial prior for ADAS-cog11 (prior = 0.03), and the observed p-value of 0.003, we calculated an upper bound on the posterior probability of 0.39 that solanezumab works. Using that as a prior for Expedition 2, its p-value of 0.06 and Eq. 1, the upper bound on the posterior probability that solanezumab works is 0.582. Caution! This is now an upper bound of an upper bound. Perhaps we might conclude, heuristically, that the chances that solanezumab works is less than 50-50.
Epilogue
Lilly decided to conduct the Expedition 3 trial in Mild patients with some modifications based on learning from Expedition 1 and Expedition 2. To make a long story short, the primary analysis p-value for ADAS-cog14 resulted in a p-value of 0.10. With a prior of 0.50 and this p-value, the final upper bound on the posterior probability that solanezumab works is 0.615.
When examining the totality of evidence (secondary endpoints, the time course of response, etc.), there is reason to believe that solanezumab does have a non-zero treatment effect compared to placebo, albeit of modest clinical importance. The marginal p-values and the resulting final posterior probability of 0.615 also support this conclusion.
Now, I mentioned aducanumab earlier in this blog. I have not done any personal Bayesian analysis using my priors and p-values from the aducanumab studies. However, I would start with a low prior, again, given the history of AD trials and even doubt creeping into the scientific community about the validity of the so-called amyloid-beta hypothesis as the cause of AD. [3]
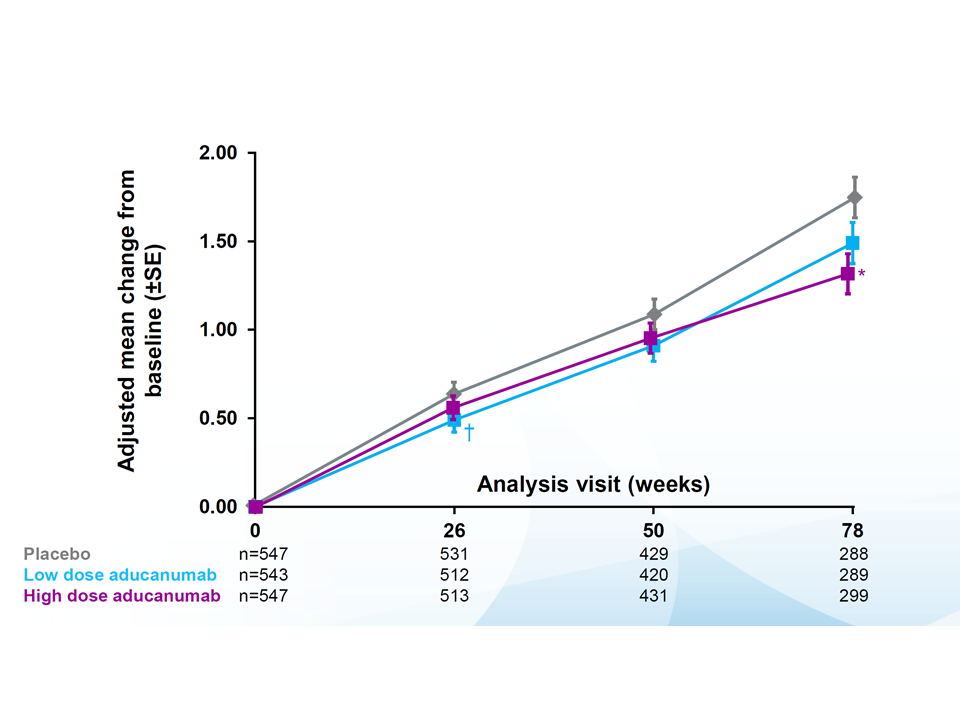
The presentation of the Phase 3 study results for the two aducanumab studies (EMERGE and ENGAGE) were presented at the Clinical Trials on Alzheimer’s Disease (CTAD) conference in December. Here is a link to the slide presentation done there.
https://investors.biogen.com/static-files/ddd45672-9c7e-4c99-8a06-3b557697c06f
What these two studies also point out is a limitation of the Bayes Factor equation that I have used herein and elsewhere in my Blog. The equation is valid for p-values < 1/e = 0.368. That is, if your p-value is larger than 0.368, there is no evidence to increase your prior belief that the null hypothesis is false. Said differently, a p-value of 0.368 is useless in terms of “evidentiary gain.” (See Blog 7: What does p<0.05 mean anyway?). Heuristically, if a p-value for a hypothesis is quite large (i.e. greater than 0.368), then that should reduce your belief that the null hypothesis is false … or increase your belief that the null hypothesis is indeed true. However, that cannot be accommodated by the Bayes Factor formula I have been using. I say this because in the ENGAGE trial, there was no evidence of a treatment effect with some p-values for cognitive measures near or larger than 0.50. That’s not a typo … they were 0.50 not 0.05. Thus, such negative results should count against the notion of aducanumab working, but they do not and cannot using the Bayes Factor formula.
Furthermore, there was lack of dose response comparing placebo, low dose and high dose. Now, to be fair, the claim is that if one examines the subgroup of patients that received the high dose for a long enough duration of time, then the results from ENGAGE look more like the EMERGE study. However, a formal p-value calculation is somewhat meaningless at this level of post hoc analysis and the fact that the subgroup of patients is smaller and under-powered to show statistical significance.
One last comment for this Blog. Above I noted that there seems to be some doubt creeping into the scientific community about the validity of the so-called amyloid-beta hypothesis as the cause of AD. This comment about the Ab hypothesis harkens back to my Blog 2 on association, correlation and causation. It is very well-documented that the presence of the Ab protein plaques in the brain is strongly associated with AD. This scientific finding is the genesis of finding treatments to reduce or eliminate Ab in the brain. However, some have questioned whether this association is really causal or merely coincidental. That is, just like polio (See Blog 2) being highly correlated or associated with ice cream consumption, yet there is no causal link. Though I am not a biological or medical scientist and I am probably way outside my lane on this, I believe it is reasonable to question whether there is some other factor that simultaneously causes Ab plaque deposition in the brain and reduced cognitive ability and functional decline. Perhaps there is an infectious agent that is the underlying cause of both. [4]. Or maybe it is something else altogether. Mother Nature has fooled us on many occasions, and we should all remain humble about our purported knowledge about how She likes to behave.
References
[1] Doody, Rachelle S. et al. “Phase 3 Trials of Solanezumab for Mild-to-Moderate Alzheimer’s Disease.” N Engl J Med 2014; 370:311-321. (with Supplementary Appendix).
[2] Sellke, T., Bayarri, M. J., Berger, J. O. Calibration of p values for testing precise null hypotheses. The Amer. Statist. 55, 62-71 (2001).
[3] Mullane, K, Williams, M. Alzheimer’s therapeutics: Continued clinical failures question the validity of the amyloid hypothesis—but what lies beyond? Biochemical Pharmacology, 85 (3): 289-305 (2013).
[4] Maheshwari, P, Eslick, G.D. Bacterial Infection and Alzheimer’s Disease: A Meta-Analysis. Journal of Alzheimer’s Disease, 43, 957–966 (2015).
