Welcome to those reading for the first time, and welcome back to those who have been along for the ride. For those just arriving, you may want to read Blogs No. 5 and No. 8, since some of the concepts herein are based on the analytical thinking described in those posts. [Of course, I ask you to consider any and all blogs on this site and follow along for future installments.] In Blog No. 8, I gave a hypothetical example of how p-values can lead one astray when it comes to finding predictive biomarkers. I have intended to write some case studies for how I use my analytical thinking to evaluate evidence or make inference about a set of scientific data. This is my first case study where I present a more in-depth and thoughtful assessment of a study and its results as a follow-up to the hypothetical example in Blog No. 8.
This case study is based on a pharmacogenomic study of dalcetrapib [1]. As a quick reference, dalcetrapib is one member of a class of drugs (CETP inhibitors) that increase HDL (the good cholesterol) and thereby is supposed to reduce CV risk of death or morbidity. Despite epidemiologic and rare family genetics findings as well as other preclinical research suggesting the increase of HDL would confer CV benefits, the dal-OUTCOMES trial failed to demonstrate any CV benefit as did torcetrapib (pre-dating dalcetrapib) and evacetrapib (post-dating dalcetrapib), which are also CETP inhibitors. Mother Nature fools again.
As a follow-up to the dal-OUTCOMES trial, some investigators pursued a genetic explanation for the results with the hope of finding perhaps a genetic subgroup for which there was a benefit. As a part of my former job at Lilly I reviewed this article with others (evacetrapib was a Lilly compound), but what I present here is strictly an assessment of the published article. Of course, in this somewhat limited space, and to make the assessment concise and understandable, I will highlight the major perspectives and some subtleties in the analysis and interpretation, but I do not claim to have deep knowledge of genetics. I am just looking at the data and going on what the investigators presented – what they said (or didn’t say) and the data and analysis they present (I do not have access to the raw data or analysis).
The story goes like this. The dal-OUTCOMES study (N=15,871 patients) showed NO clinical benefit. This was a study conducted to the high standards of pharma and FDA and certainly provided quality data. There were 5749 patients who consented and were used in genome-wide association study (GWAS) using the original clinical outcome definition – a prespecified composite endpoint of coronary heart disease death, resuscitated cardiac arrest, nonfatal myocardial infarction, nonfatal ischemic stroke, unstable angina or unanticipated coronary revascularization. This was to serve as the “discovery” study or hypothesis generating study to sort out what genetic variants might be associated with positive (or adverse) clinical outcomes.
The dal-PLAQUE2 study consisted of 931 patients in a double-blind, randomized, placebo-controlled, parallel group trial designed to evaluate the effect of dalcetrapib on atherosclerotic disease progression in patients with evidence of coronary artery disease and carotid intima-media thickness (IMT). The primary outcome was change from baseline in carotid IMT using ultrasonography at 6 and 12 months. Of the 411 that consented to genetic testing, 386 had imaging measures at baseline, 6 months, and 12 months and were included in the analysis. This was to serve as the “validation” study.
So, the idea of using one dataset to explore associations and then applying those findings to an independent dataset to possibly confirm those findings is laudable, though one could question:
- the patient populations (entry criteria of recent acute coronary syndrome event in dal-OUTCOMES versus coronary artery disease as indicated by IMT>0.65mm in dal-PLAQUE2),
- the primary outcomes are quite different (clinical events versus surrogate measure of carotid artery narrowing), and
- the sample size in the validation study is quite small (n=194 dalcetrapib and 192 placebo).
Nonetheless, let’s evaluate the findings from a statistical evidence point of view.
First, in the dal-OUTCOMES trial, 5,543,264 genetic variants were examined for possible association with the clinical composite outcome. In evaluating these variants, “the genome-wide significance threshold P<5×10⁻⁸ was used for the discovery GWAS to adjust for the multiple testing of genetic variants.” That’s p<0.00000005. Using such a conservative significance level is common practice and is an approximate attempt to utilize the Bonferroni correction when testing millions of variants. WHAT IS IMPORTANT ABOUT THIS STATEMENT and other information in the paper is that there is NO INDICATION OF ANY PRIOR KNOWLEDGE AS TO WHAT VARIANT MIGHT BE A PREDICTIVE BIOMARKER FOR THE DALCETRAPIB TREATMENT. This lack of prior knowledge will be consequential in my analytical thinking to be described later. Stay tuned.
In dal-OUTCOMES, the search was done by looking for significant effects within the dalcetrapib group by assessing the trend in response across a homozygous minor allele (for example, AA), heterozygous allele (AG) and homozygous major allele (GG) using a 1 degree of freedom trend test. For any significant findings, “genetic variants were next tested to confirm absence of association in the placebo arm and to test for gene-by-treatment interaction with both arms.” It is not good statistics or good science to find a change in response to a treatment that is “significant” (whatever that means; see Blog No. 7 “What does p<0.05 mean anyway?”) and then investigate the placebo group separately to find a “non-significant” response and declare there is a treatment effect. This is a well-known inferential fallacy. This will become clear to those who are not familiar later in this critique. Stay tuned.
Second the dal-PLAQUE2 was to evaluate genetic effects of 20 single nucleotide polymorphisms (SNPs) in the ADCY9 gene, which were identified as being of interest from the GWAS study of dal-OUTCOMES, “along with 7-SNPs [in the ADCY9 gene] selected based on literature and functional prediction.” That’s a total of 27 SNPs in the “validation” study if you are keeping score, which you should be! Interestingly, the authors state, “Adjustment of the significance threshold for multiple testing of the 27-SNPs … was not applied because of the highly correlated nature of the selected SNPs. As reference, the number of independent tests (Meff) was estimated using the method of Gao et al [2] to Meff=8.” We know that correlated tests do not need as much of a statistical adjustment as independent tests, so this is appropriate thinking and the method of Gao et al is reasonable. However, totally discarding any adjustment is questionable and could serve the authors’ purposes of finding significant results. Stay tuned.
Now for the results.
There was only one SNP on chromosome 16, ADCY9 gene labelled rs1967309 that had a p-value ( 2.41×10⁻⁸) less than the stated significance level of 5×10⁻⁸. There was one other SNP that came close to significance at the prespecified level, and it was rs2238448 (8.88×10⁻⁸). Taking a Bayesian perspective as advocated in previous blogs, I need to develop a prior for testing each of the 5,543,264 genetic variants.
In quantifying a prior, I offer the following considerations:
- Since the authors did not identify any particular variants of interest at the start of the study, and the fact that they were doing a GWAS implies to me that they would be willing to have a uniform prior for all 5,543,264 genetic variants. That is, there is no a priori variant or set of variants that may drive a differential treatment effect.
- GWAS studies have not always panned out well or provided definitive information on genetic findings.
- The possibility that there is a single SNP or other genetic variant that would drive the response of a single treatment on a complex, composite outcome is unlikely.
When taken together, I think it would be generous to give an overall prior of 50% chance of there being a significant finding from the GWAS study. That is,
Prior probability of success (any individual variant H0 is false) = 0.50;
Prior probability that H0 is true (none of the 5,543,264 variants are predictive) = 0.50.
Now, some may argue that 50% is reasonable since our genetic code must do something, and if we examine millions of genetic features, there is a reasonable chance we could find a predictive marker. OK, I guess that’s sensible; so I will stick with the middle ground of 50%.
There are 5,543,264 genetic variant hypothesis tests and putting a prior on each one might seem like a daunting task. Indeed, it is impossible if one were to consider each genetic variant individually. Also, these variants are correlated, so we cannot use a conservative and simple Bonferroni correction. For simplicity (though there is some rationale for this that is too long to describe herein), we estimate that the 5,543,264 genetic variant hypothesis tests are statistically equivalent to about 1,000,000 independent hypothesis tests in terms of multiplicity correction. So, using a uniform prior across all variants simply gives a prior of 0.50/1,000,000 = 5×10⁻⁷ for each individual hypothesis test.
With that context (remember a p-value is uninterpretable in terms of assessing the probability of the truth or falsehood of a hypothesis without some context quantified by a prior probability), we can use the Bayes Factor formula that I have been espousing to calculate the upper bound on the probability that a particular SNP H0 is false, i.e. that the SNP is a predictive biomarker. As in Blog No. 8, the Bayes Factor Bound is
BFB=1/[-e * p * ln(p)],
where p=the p-value of the hypothesis test of interest, and the upper bound on the posterior probability that H0 is false (p1) given the observed data is
p1 < {1 + [(1-p0)/p0] / BFB }-1 (Equation 1),
where p0 is the prior probability that H0 is false.
Using Eq 1, we have the following posterior probabilities in shown in Table 1 (first three columns).
Table 1. Posterior probabilities using a uniform prior on each SNP hypothesis test of 5×10⁻⁷ and Eq 1 derived from the Bayes Factor Bound.

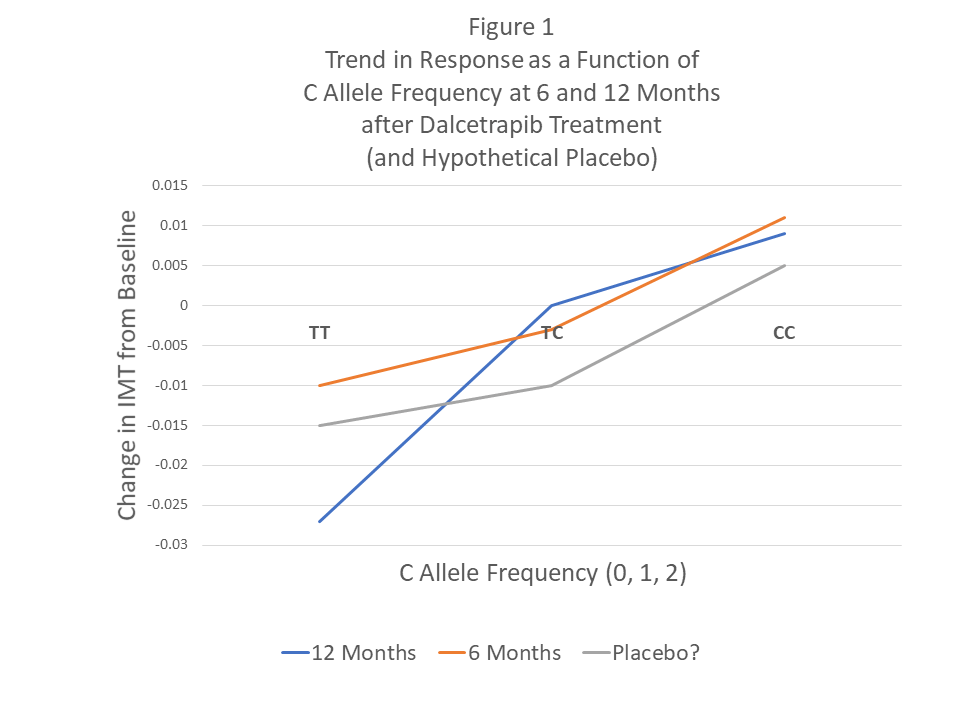
*This is a p-value for a linear trend test within dalcetrapib treatment as a function of allelic frequency: TT, TC, CC. As such, it is NOT a treatment effect versus placebo (see Figure 1).
In true Bayesian paradigm, if we use the posterior from the GWAS study as the prior for the dal-PLAQUE2 study, and apply Eq 1 again, then Table 1 (last two columns) shows the upper bound on the posterior probability that the SNP is a predictive biomarker. Note that the last column is an upper bound of an upper bound, and so it could be quite optimistic.
The authors conclude the article with a recommendation, “we think that rs1967309 should be used in the next clinical trial.” However, when examining the totality of evidence, based on this analysis, rs2238448 actually has a higher overall probability of being a predictive biomarker (though I do NOT agree with the within treatment analysis of trends as done in dal-PLAQUE2 and the published p-value). This example at least illustrates the analytical thinking and the repeated use of approximating the Bayesian posterior probability of H0 being false that is more interpretable than a sequence of p-values.
Another consideration is that the targeted subgroup defined by rs1967309 genotype AA (homozygous minor allele representing ~20% of the population) showed a 39% reduction in CV risk compared to placebo. Heterozygous patients (AG genotype) showed no reduction in CV risk relative to placebo and, the homozygous major allele (GG genotype) showed an increase in risk of 27% relative to placebo. This is a classic case of the following principle: if one subgroup shows a significant positive treatment effect in a trial where the overall effect is minimal or non-existent, then there must be a complementary subgroup with a (significant) negative treatment effect. One might question the biological plausibility of this scenario in this case. Is it reasonable to believe that a genetic variant that causes a significant positive effect (dalcetrapib much better than placebo) also has a complementary genetic variant in the same gene/SNP that has a significant harmful effect?
In the dal-PLAQUE2 study, I mentioned an inappropriate analysis of the genetic effects using within treatment comparisons. For example, for rs2238448, which was the other genetic variant of interest in the article, the reported trend p-value of 0.009 is of questionable meaning or importance. Figure 1 shows the change in IMT from baseline at 6 months and 12 months post treatment with dalcetrapib, but we have no reference group with which to make a comparison – i.e. placebo. We only know from the article that there was NOT a significant interaction – a true measure of a predictive bioimarker. I have drawn a HYPOTHETICAL placebo response profile with no significant interaction to show how the proposed predictive SNP may have no differential treatment effect from placebo.
In fact, the article mentions that there was only one significant interaction test in dal-PLAQUE2, and it was for yet another SNP, rs2531967, with a p-value of 0.024. That is one of the 27 SNPS investigated in that study for which no multiplicity adjustments were made, despite the Meff=8 (as noted above). Using 8 as an effective number of comparisons, a simple Bonferroni adjustment to this p-value would be 8*0.024=0.192, hardly worth noting at all. Furthermore, the GWAS p-value for this SNP was 6.67×10⁻⁴, resulting in a posterior probability for rs2531967 being a predictive biomarker of 3.77×10⁻⁵ using Eq 1, a vanishingly small probability.
Finally, as with any decision, the desire to proceed with a subsequent CV outcome trial in the targeted subgroup of rs1967309 with genotype AA, as recommended by the authors, needs to be balanced with benefits and costs. Another large, long-term study would be incredibly expensive and time-consuming with a probability of success (much?) less than 39% (Table 1). In fact, if we throw out the inappropriate p-values from dal-PLAQUE2, that probability is less than 30%. Even though the effect size may be large (39% CV risk reduction, though this estimate is likely biased upward as well), many patients would have to be screened since the proposed subgroup represents on 20% of the population.
Overall, p-values do not tell the story, and Bayesian posterior probabilities are warranted. That coupled with the inappropriate p-values from dal-PLAQUES2 produces unconvincing evidence for any of the reported SNPs to be predictive biomarkers for dalcetrapib.
The Rest of the Story
A newly formed company, DalCor, initiated a trial called dal-GenE that has completed enrollment of 6000 patients selected for the AA genotype at variant rs1967309 in the ADCY9 gene. The final results will be available at the end of 2020 or early 2021. It’s a huge bet ($150,000,000) on relatively scant evidence and suspect analysis – as well as no biologic mechanism or molecular knowledge linking the ADCY9 gene and CV function [3]. The good news is, we will have a definitive answer as to whether the findings from dal-OUTCOMES was a false positive or the real deal. If you believe my analytical assessment, the odds are that it was a false positive finding. That’s where I am placing my bet.
References
[1] Tardif, J. C. et al. Pharmacogenomic determinants of the Cardiovascular Effects of Dalcetrapib. Circ Cardiovasc Genet. 2015; 8:372-382.
[2] Gao, X. et al. A multiple testing correction method for genetic association studies using correlated single nucleotide polymorphisms. Genet Epidemiol. 2008; 32:361–369.
[3] http://www.cardiobrief.org/2016/04/20/new-company-bets-hundreds-of-millions-of-dollars-on-a-genetic-strategy-to-resurrect-a-cetp-inhibitor/ (Accessed 9/9/2019).
