
Background
In his famous story Alice in Wonderland, Lewis Carroll tells of Alice wandering (wondering?) on a path in the woods through a strange land. Alice comes to where the path diverges into two direction whereupon she encounters the Cheshire Cat. Part of their conversation goes like this:

Alice: “Would you tell me, please, which way I ought to go from here?”
Cheshire Cat: “That depends a good deal on where you want to get to.”
Alice: “I don’t much care where—”
Cheshire Cat: “Then it doesn’t matter which way you go.”
Alice: “—so long as I get SOMEWHERE.”
Cheshire Cat: “Oh, you’re sure to do that, if you only walk long enough.”
I have read some articles in Medium.com (Towards Data Science) and other publications about the three phenotypes for Data Scientists – Analysts, Statisticians and ML/AI (reference). There are some very apt descriptions in these publications for characterizing these three phenotypes, and there are some prevailing stereotypes that are not quite so apt. I am going to focus on the roles of Analysts and Statisticians in particular because that is where my deepest experience lies, and I can share my DIRECT observations as well as some additional musings on the topic to complement (or maybe to adjust) what has been written on this topic elsewhere.
The heart of the distinct classification of Analysts and Statisticians is depicted in the following diagram.
Some writers claim that these two roles “are completely different from one another.” I believe that there is a bit of a false dichotomy here. I see it more as a continuum. Certainly, I agree with the notion that people having both skills are a real prize (not to mention ML/AI skills, but I am leaving that aside for this article). I just think that the combination of such skills is not that rare based on (a) my experience as a statistician, (b) a leader of a broad analytics group (reference to my first post) and a (c) hiring manager of such broad analytics talent.

OK, you can read what follows as defensive (the statistician fighting for his turf) or inclusive (based on this statistician’s direct experience).
Analysts, Statisticians and Exploratory Data Analysis
First, statisticians have been doing exploratory data analysis for decades (see Exploratory Data Analysis, John Tukey, 1977). Of course, the data sets are much larger today, the computing power enormously faster, and there is the inexorable advance of newer methods and ideas. However, many of the principles are the same. Tukey’s book is a culmination of his many works starting with his classic paper “The Future of Data Analysis” (1962). Even many of the exploratory techniques used today for analysis of multivariate data sets have their origins in the statistical literature dating back many decades – e.g. clustering (Fisher, 1936), principal components (Pearson, 1901), logistic regression (several authors, 1930’s and even a longer history before that). And while visualization has long been a key aspect of scientific and business communication and a central element of Tukey’s work, it was brought to the statistical forefront in the book The Visual Display of Quantitative Information (Tufte, 1982).
Now, to be fair, it has been said that Tukey wrote his landmark book Exploratory Data Analysis to encourage statisticians to pursue avenues of statistical thinking beyond hypothesis testing and rigorous mathematical statistics. A cause that is laudable to this day!
OK, to be sure there are mathematical statisticians. Yes, there are statisticians who focus their efforts on rigorous, confirmatory analysis. However, there are many statisticians who traverse the continuum from exploratory, quick-and-dirty analysis to sophisticated, rigorous results for decision-making. What I like about the emergence of data science in the last two decades is that it does prod statisticians and all data analytical scientists to be more open to exploratory data analysis and visualization.
Lastly on this topic, I agree that Analysts are “far from being a sloppy version” of a Statistician. On the contrary, doing exploratory data analysis requires some thoughtful consideration (not necessarily long deliberations) about whether the problem at hand is better addressed by, for example, model building and prediction or clustering and classification. I have worked with and recruited many statisticians who live at either end of the continuum (yes, we called them statistical analysts or statistical scientists at my former company), but there are also many who move freely and easily across the continuum. I also believe that even on the far exploratory end of the spectrum of analytics, there is still a need for some interpretation, some quantification or qualification of what the data might mean.
Just the Facts and Nothing but the Facts
In another Medium posts on this topic, a good Analyst has been described as follows: “Good analysts have unwavering respect for the one golden rule of their profession: do not come to conclusions beyond the data.” In fact, the primary role of an Analyst is: “Here’s what’s in our data. It’s not my job to talk about what it means.” Furthermore, there was the following statement. “A frequent lament among business leaders is, ‘Our data science group is useless.’ and the problem usually lies in an absence of analytics expertise.”
My direct experience with my business leaders (as well as some indirect anecdotal evidence) is that business leaders have been frustrated by too many Analysts who pour through all sorts of data, find multitudinous patterns and associations, but cannot tell the business leader what any of it means. They generate gobs of “leads” with no ability (or interest … or maybe even intent) to discern what is likely to be useful or real or meaningful. Adapting a famous quote from Henri Poincaré, I would say that a ‘modern business is built up with analytical results, as a house is built with stones. But a collection of analytical results is no more valuable to a business than a pile of stones is to an architect.’ Storytelling and inspiration have their place, but all too often it is easy to fall in love with our own stories or generate enthusiasm for what turn out to be nothing but myths.
Business leaders want to know how to generalize beyond the immediate data and the analysis that was done in some fast, exploratory approach. The greatest fear that was often communicated to me by business leaders was that a data scientist (whether it be a business analyst, a computer science specialist or a statistician) would have them chasing “red herrings” or burrowing down multiple “rabbit holes.” Now, I am NOT advocating for the Statistician to swoop in and do the detailed analysis and give the rigorous answer and save the day. I am just saying that the model of the Analyst rapidly exploring the data freely, without purpose or without direction to a particular question can be dangerous.
Analysis is very easy.
Interpretation is very hard.
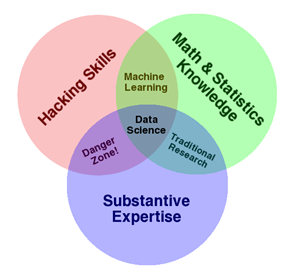
I refer to the diagram and description by Drew Conway that was presented in 2010 but is still relevant today … if not more relevant. The danger zone, as he describes it, is at the interface of people with coding skills and some subject matter expertise. Drew uses the common phrase to describe them: they know enough to be dangerous. His explanations of this diagram provide pertinent insights for today’s Data Science world.
Lastly on this topic, I do not like the notion of an Analyst producing lots of findings and inspiring stories without interpretation beyond the data, and then throwing the ball over the fence to a business leader and subsequently a Statistician or Machine Learning expert to figure out what is true and actionable. I much prefer a partnership of exploratory and confirmatory data analysis where there is a joint effort of fast-but-thoughtful, broad-but-focused, exploratory analysis that allows for some assessment of uncertainty about any finding. The Analyst (statistical or otherwise), the Statistician and the Business (or Scientific) partner working collaboratively, interactively and productively.
Rather than producing many analyses fast and then seeking to find the question worth pursuing, I prefer identifying the question and then pursuing the right data with smart analytics to get an answer (along with a measure of uncertainty).
The Question is “What’s the Question?”
In one of my interactions with a very senior business leader, we had the following dialogue that went something like this:
Leader: “If you hire 4 PhD mathematicians from MIT, I will give them access to all of my enormous amount of data. Then they can tear it apart and tell me what’s in it for my business.”
Me: “I already know what is in it.”
Leader (incredulously): “What do you mean?”
Me: “Well, there’s lots of patterns and associations among the many variables in your very large business database. The vast majority of them are, at best, not very useful and, at worst, completely spurious. There are a select few that are real or meaningful. What I don’t know is what decisions you want or need to make and whether any of the real/meaningful findings will impact your business.”
Leader: “Well, what do you propose?”
Me: “Rather than sending me (or 4 PhD’s from MIT) off to explore the world, why don’t you tell me what part of the world is most important to your business. What keeps you up at night? What information do you need to make an important decision that is coming? If you could answer one question to help you make a better or more confident decision, what would that question be?”
Leader: “OK. I like this. Explain more.”
Me: “If you point me in the right direction, then we can first see whether we even have the right data (not just the big data that you have) to answer that question or surface that information. If we do, then we will start to explore it – slice it and dice it in many ways to find promising leads. But if we do not have the right data then you (and I) will have to decide where, how, if we want to get it. That could be easy (i.e. buy some commercially available database) or very hard (i.e. redesign our business information systems to collect different or better or more data). Alternatively, we could find a similar question that we could answer with the data we have that could be good enough to help your business.”
Leader: “I like this approach. What’s next?”
Me: “What is the #1 thing that keeps you up at night? What decision do you have to make in the near future for which you wish you had better information? When do you say to yourself … ‘If I knew <this> or could predict <that> better, then I would decide to <insert business action> rather than <insert alternate business action>’? Can you give me an example?”
The Leader immediately stated 4-5 such business questions that he wanted answered, and I and my group (statistical analysts and statistical scientists) were off and running with some of his business lieutenants to explore and seek meaningful answers.
Conclusion
I can accept the notion that an Analyst is a speed merchant and their major value proposition to the arena of data science is “fast.” My concern is that when executed independently and separately from other quantitative assessments and business thinking – let someone else figure out what important or real – it does not add much value to the overall business or research enterprise. It feels too much like, “Shoot first and ask questions later.” And I am reminded of the warning, “Speed kills!” I am sure there are many Analysts who would sacrifice some speed to improve the quality of their analysis and the interpretation of what the results convey. I also believe that Analysts can gain valuable experience and subject mater expertise to improve their ability to act quickly with the data and to do so with greater understanding of what might be real and actionable versus spurious and meaningless. However, in matters of analytics, uncertainty or probability, Daniel Kahneman, the Nobel Prize winner, warns us to be careful about our intuition, i.e. thinking fast. (More on that in another article).
I accept the notion that the Statistician’s value proposition is “rigorous” but reject the notion that such rigor implies a slow process. That process can be laborious, but it isn’t always that way. I do not like the implication of paralysis by analysis conferred to statisticians, though admittedly this stereotype does have some basis in reality. In the previously cited Medium posts, the role of the Statistician was described as, “not to produce Truth but rather a sensible integration of palatable assumptions with available information.” That’s reasonable. As I have said in my previous articles, Statistics is about discerning what is LIKELY to be true.
Finally, I prefer asking important questions that have at their root meaningful issues related to the business or scientific problem at hand. I prefer a strong tripartite approach to Analytics in general – an Analyst, a Statistician and a Subject Matter expert. It is a three-legged stool – none takes primacy over the other. Without any one of the legs, the stool cannot stand. I believe it is more than just analysis, algorithms, math or statistics – it’s about understanding, interpretation, meaning … and ultimately making decisions on what to do next. That requires a team effort from start to finish.

I started this article with Lewis Carroll’s famous story Alice in Wonderland. It was Lewis Carroll who is credited with saying,
“If you don’t know where you are going, any path will do.”
In the context of data science (or any scientific endeavor), I like to say,
If you don’t know the question, any answer will do.
Or maybe said differently,
If you don’t know the question, ANY ANSWER COULD BE TRUE.
